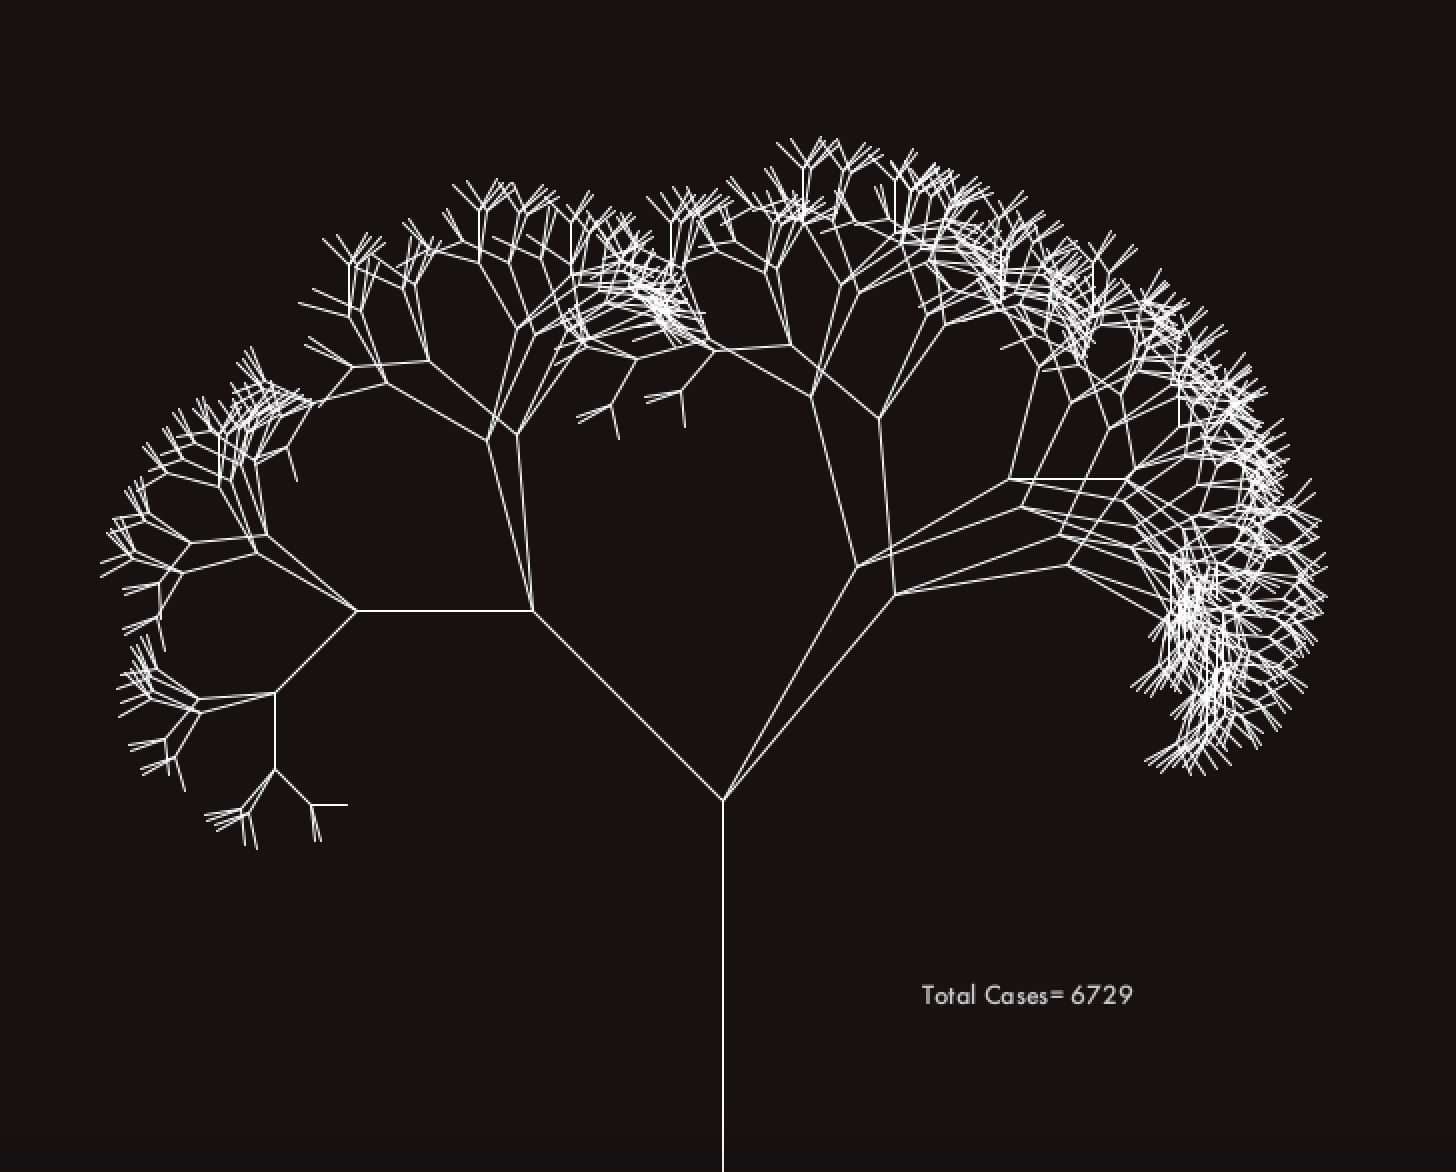
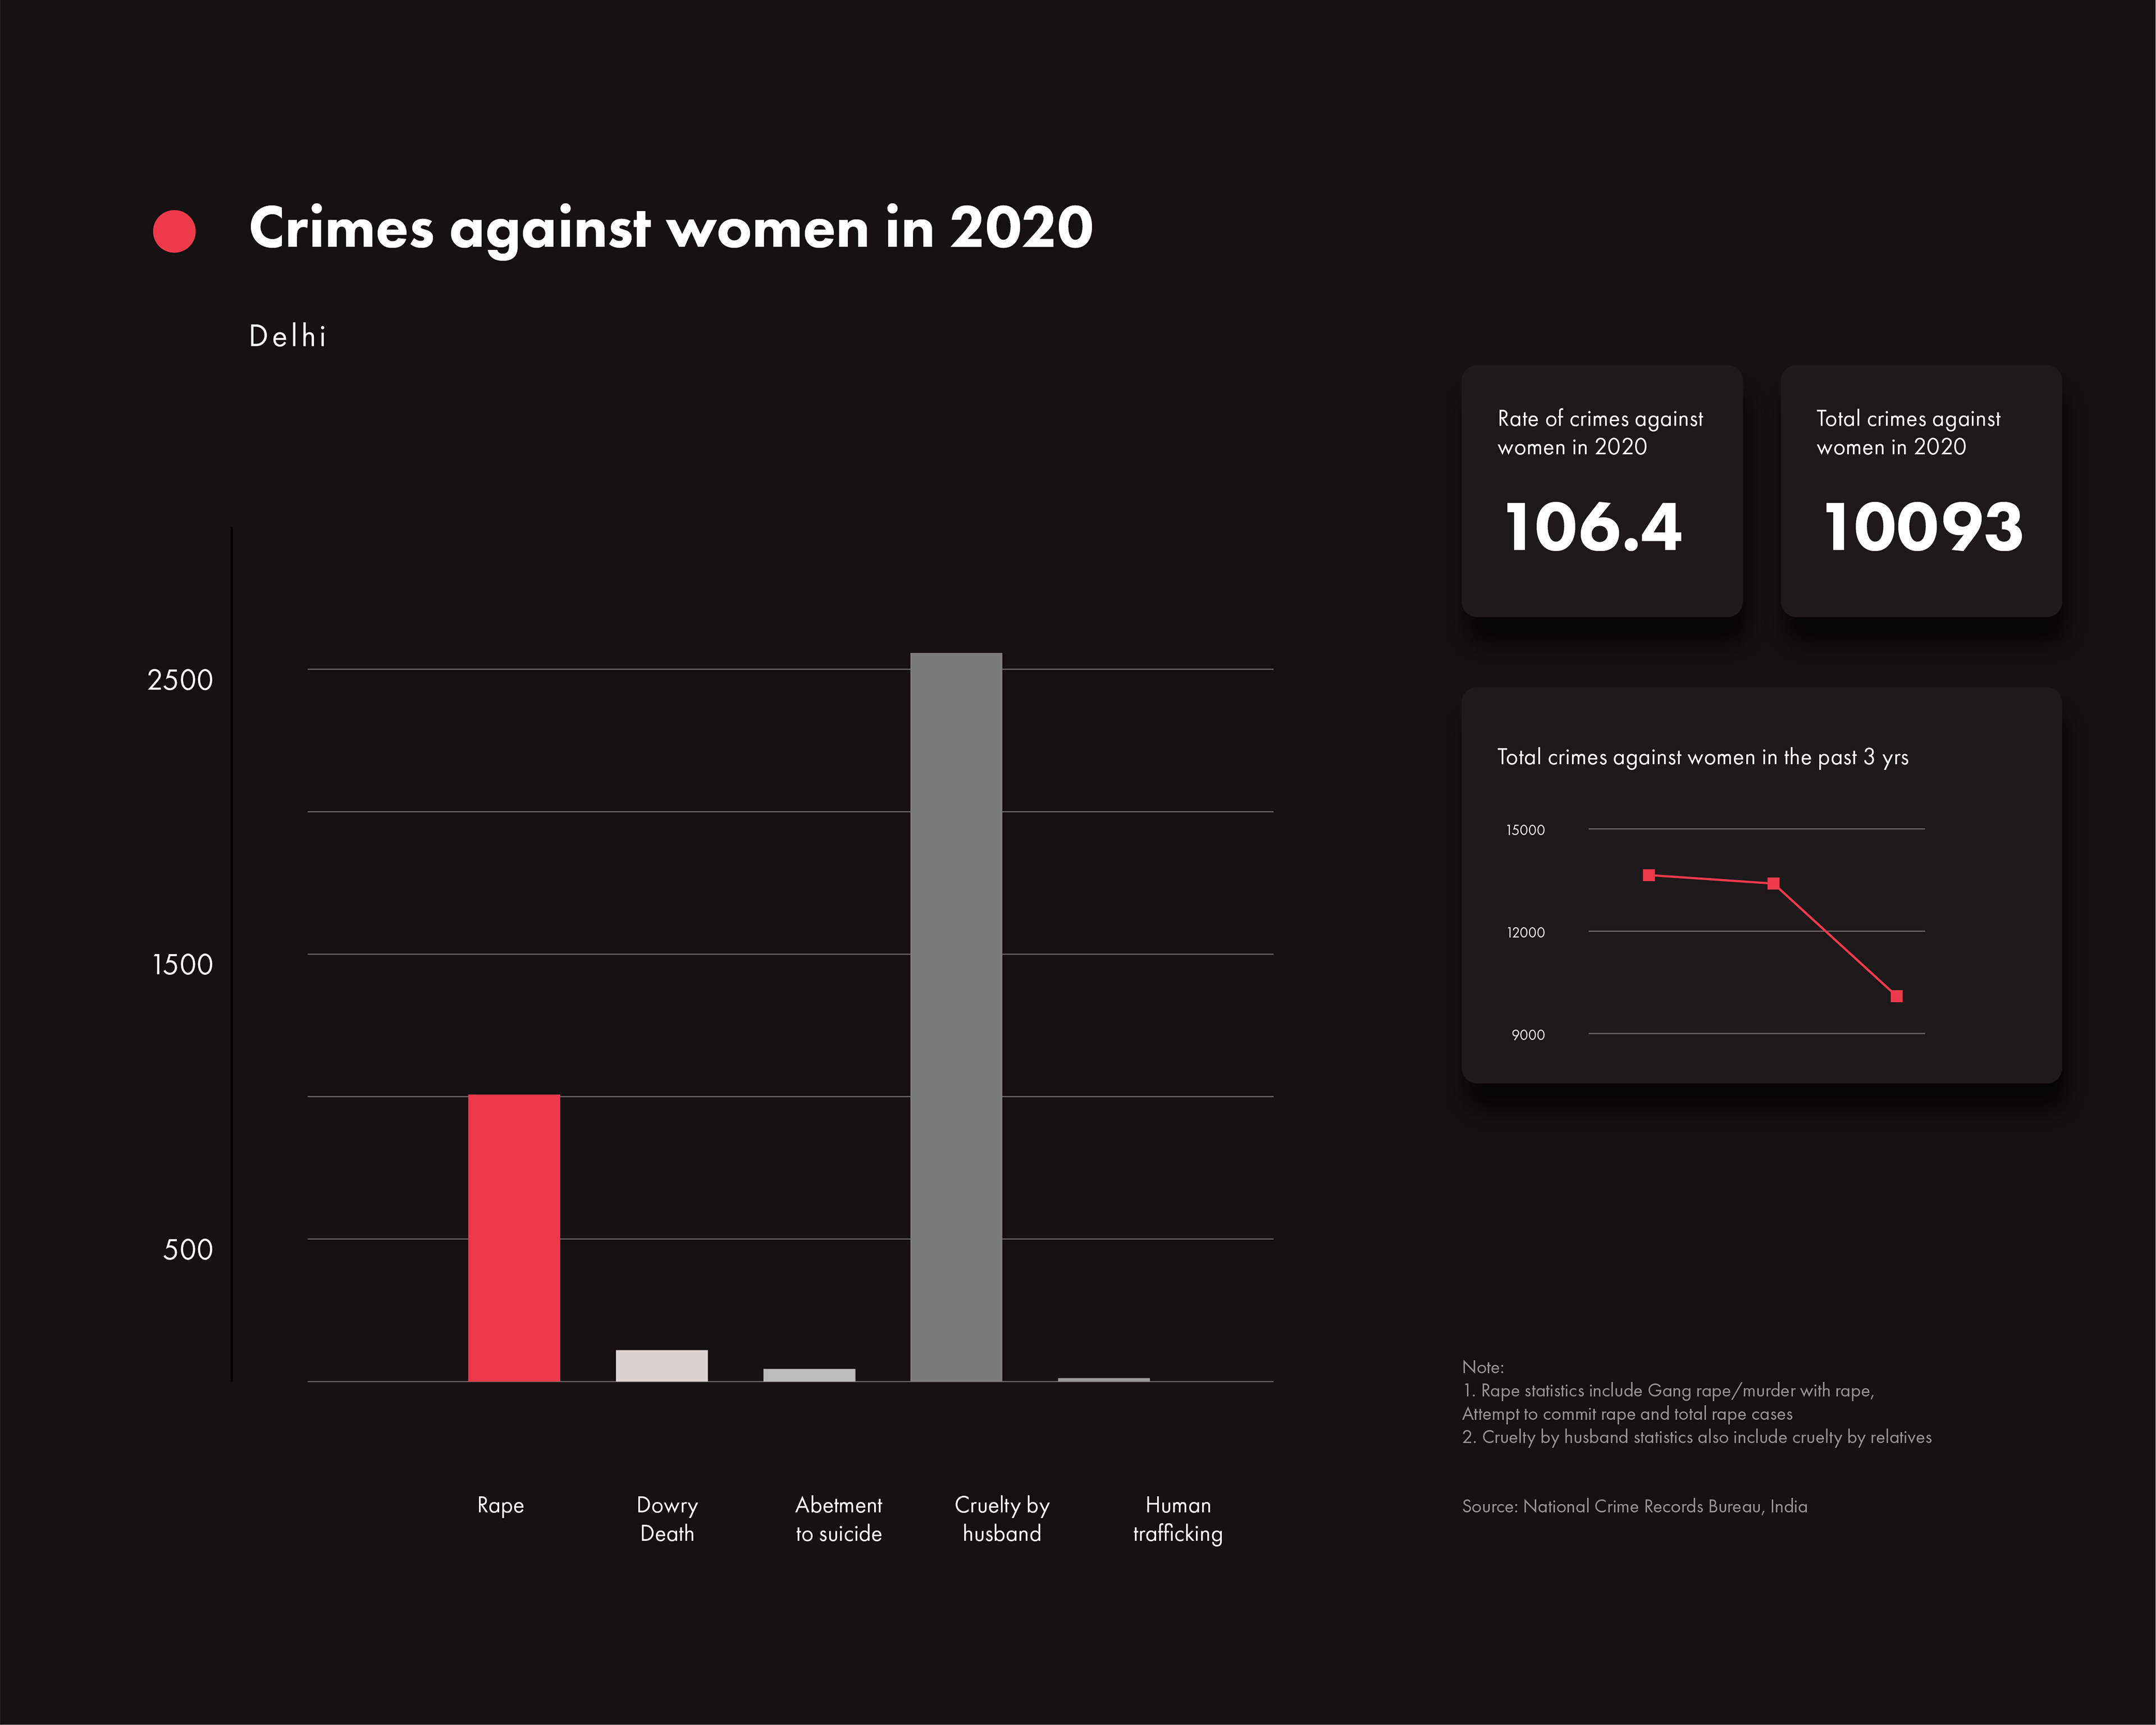
An interactive data visualization on the crimes against women in India. It was made using processing.
The rate of crimes against women in India has been on a constant rise. It deeply pains me to see the statistics on the rising crimes against women in my country. Hence, I decided to show the alarming rate of crimes with an intention to make people aware about the horrifying situation.
Objective: To make the data on a serious topic like crimes against women– easier to understand. The aim of this visualization is to generate empathy among the viewers.
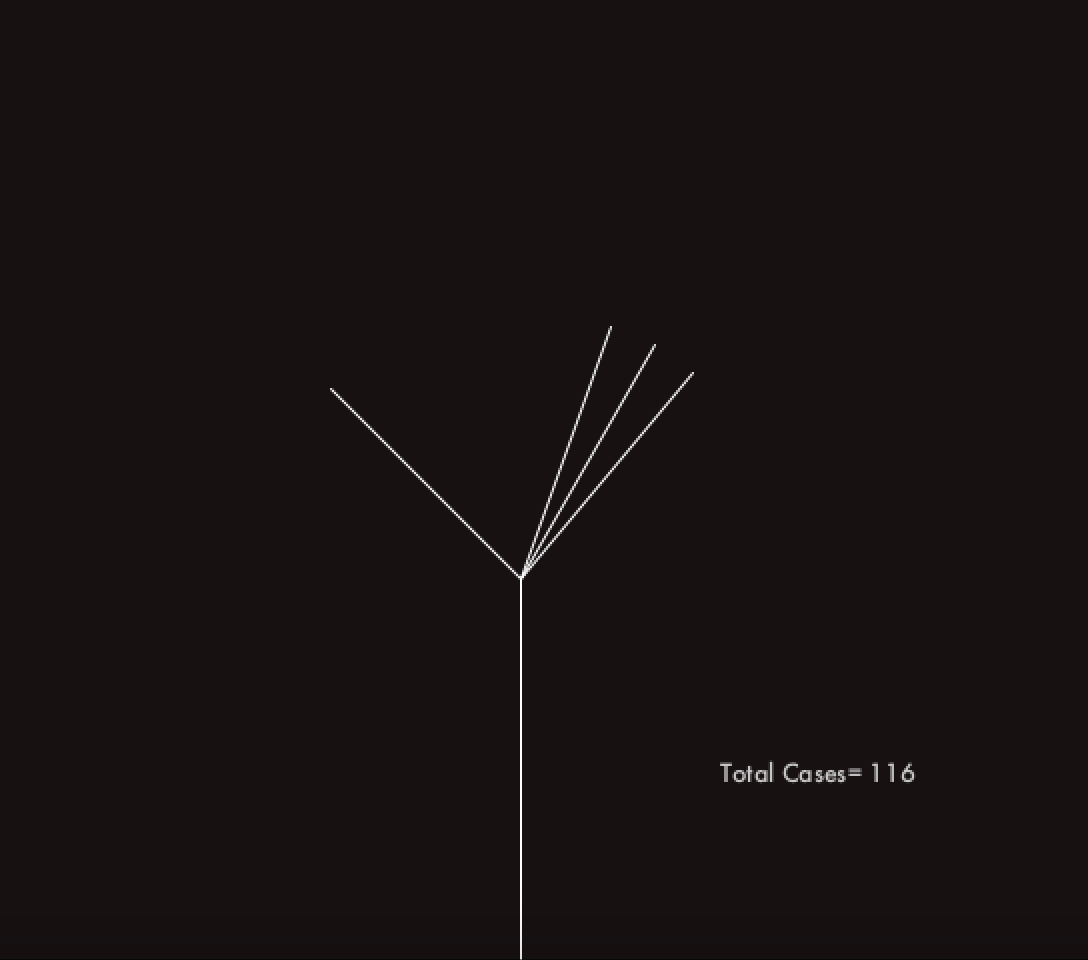
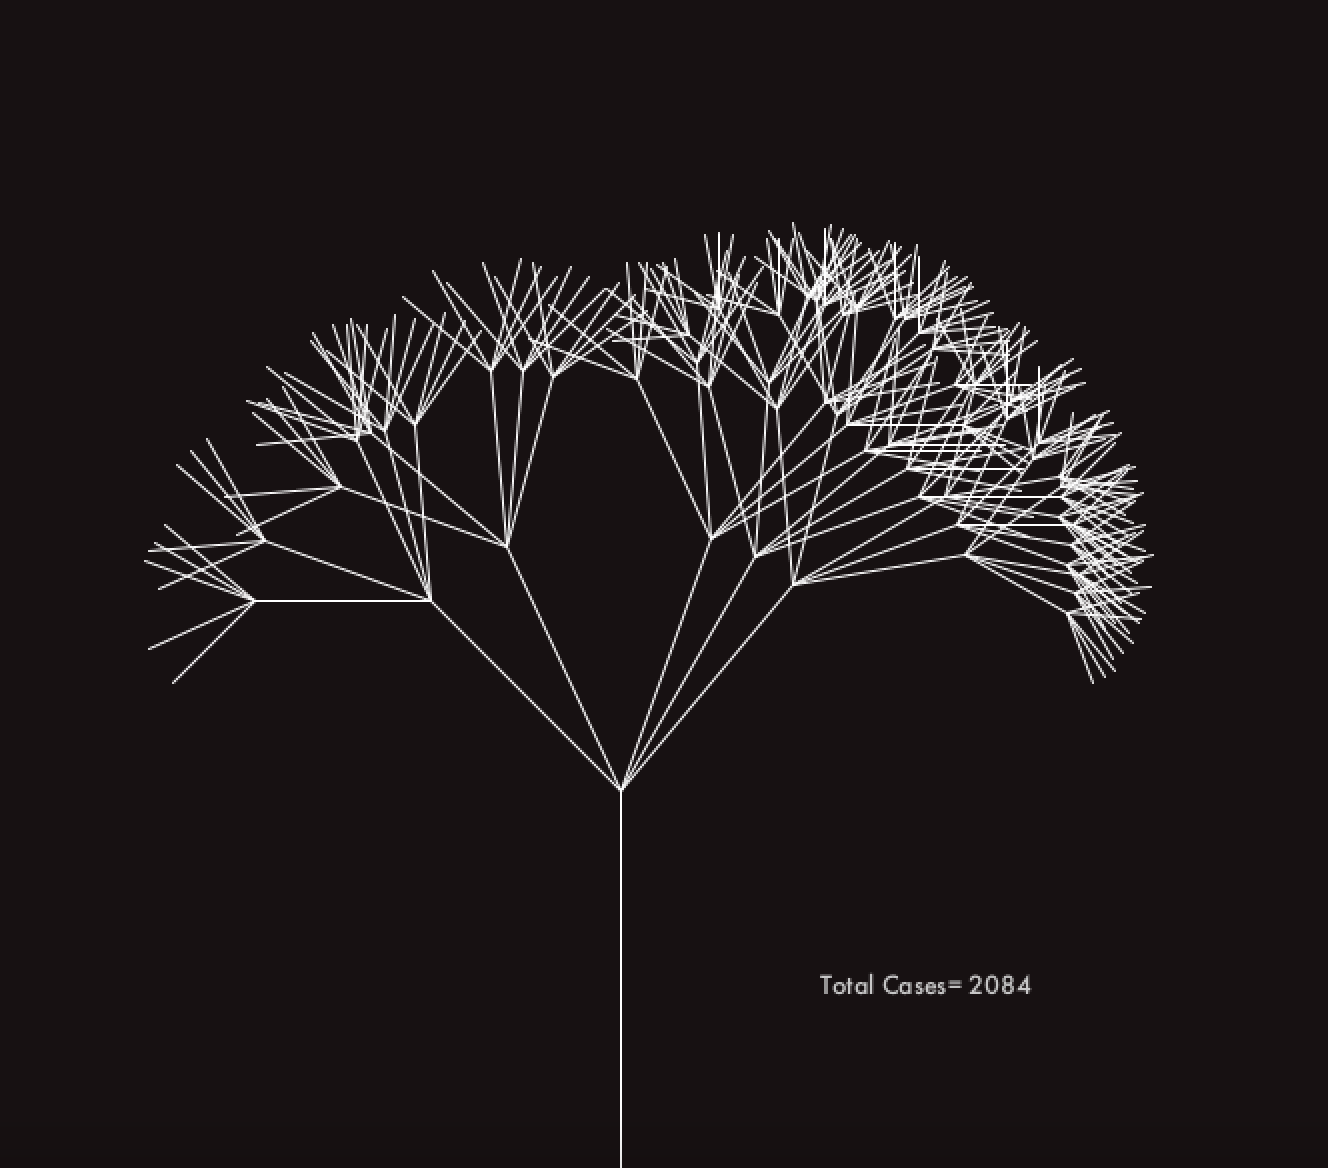
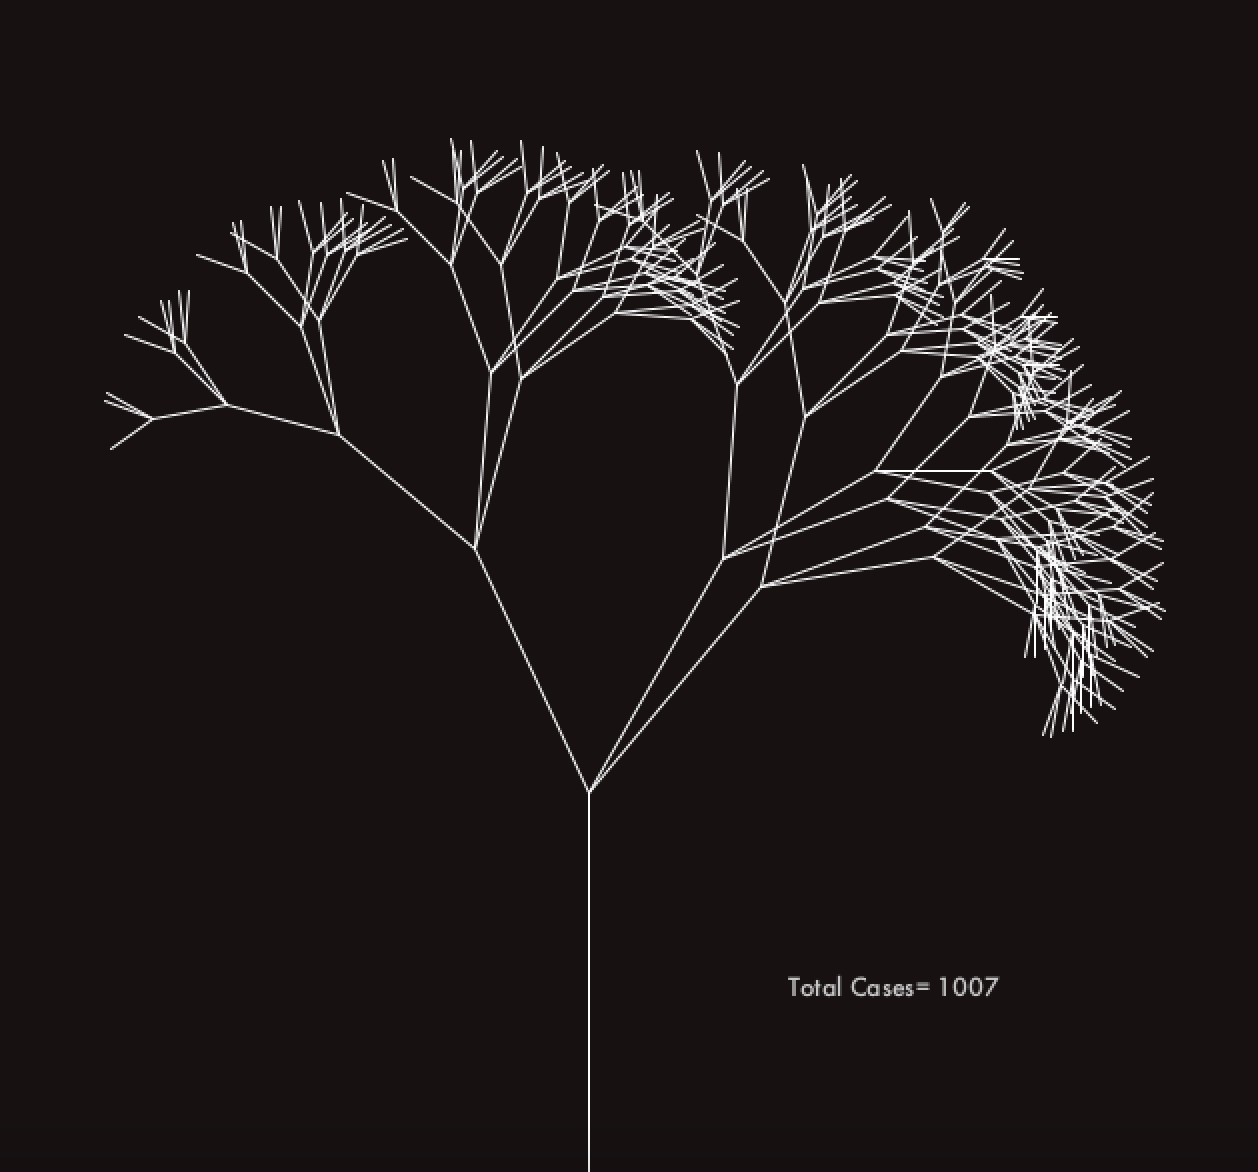
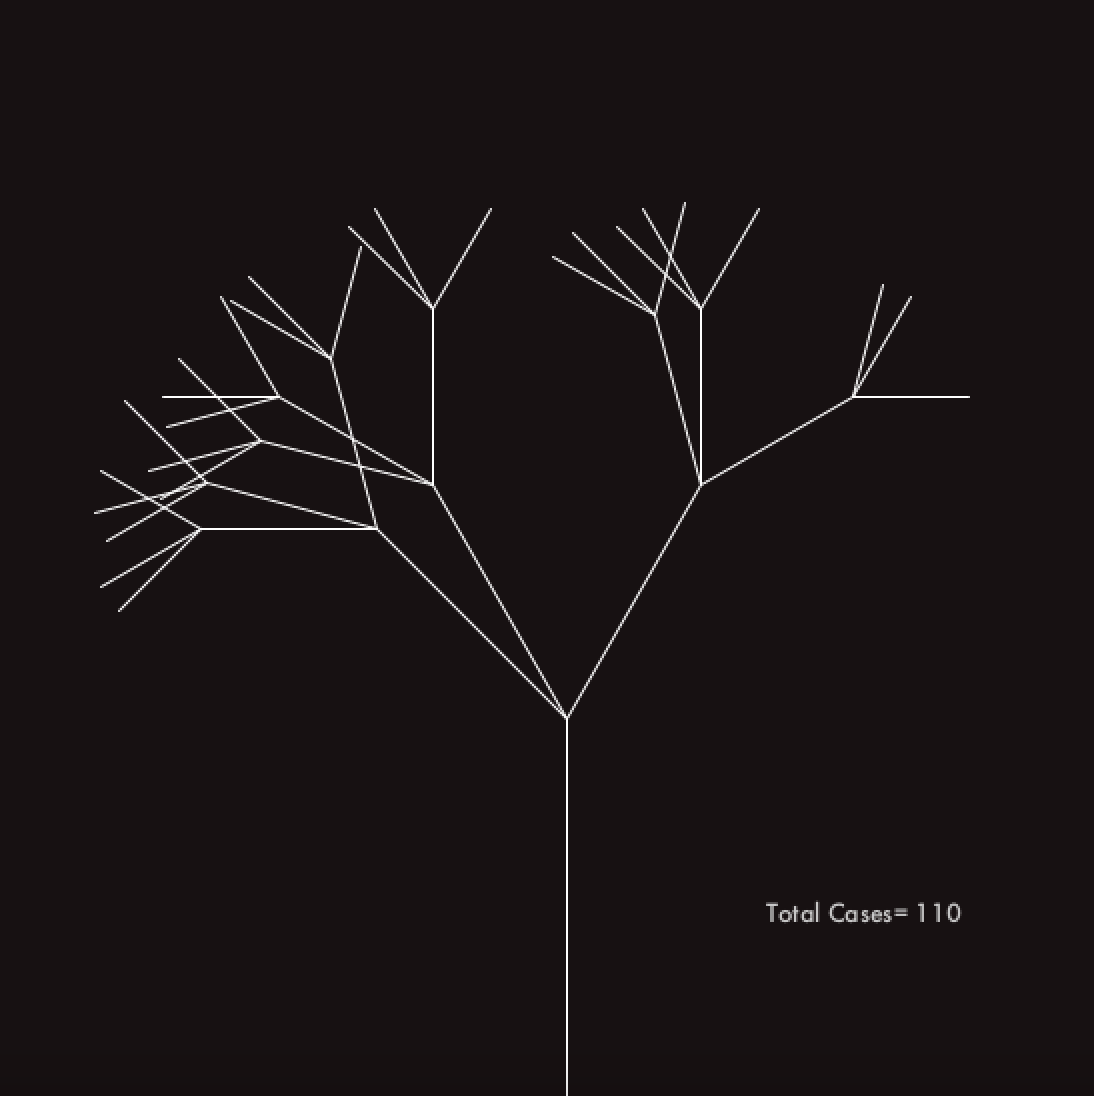
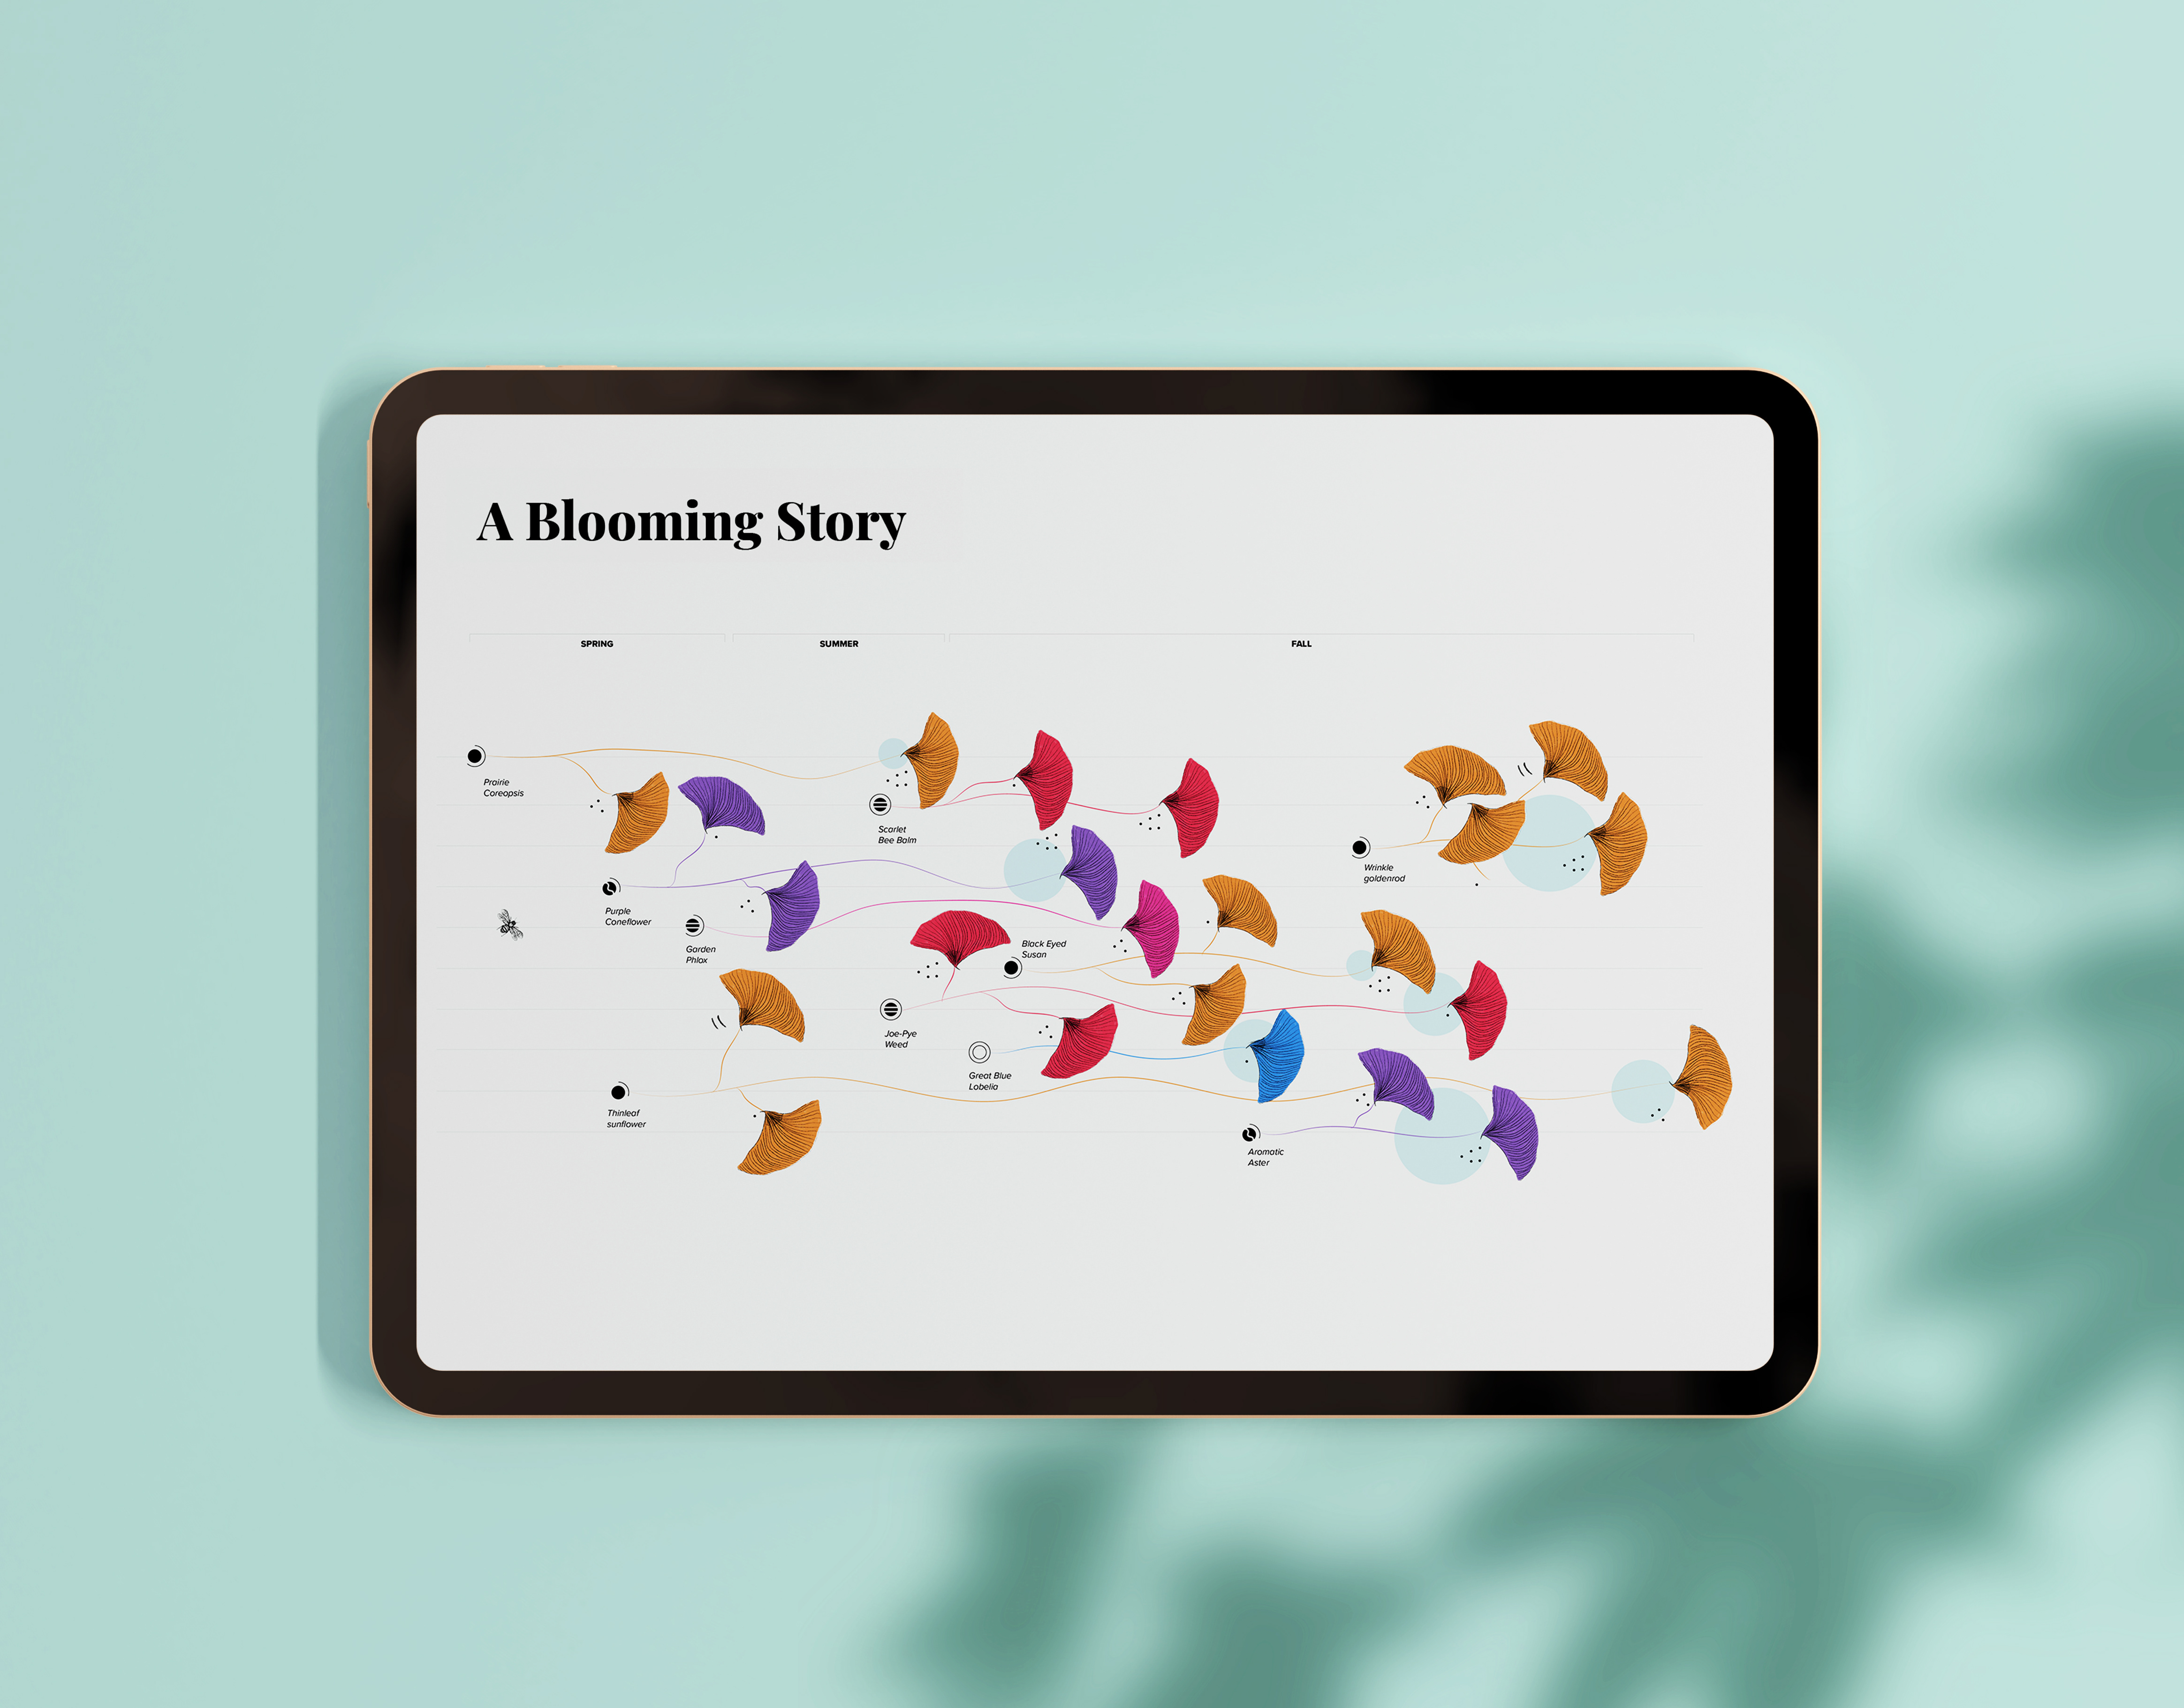
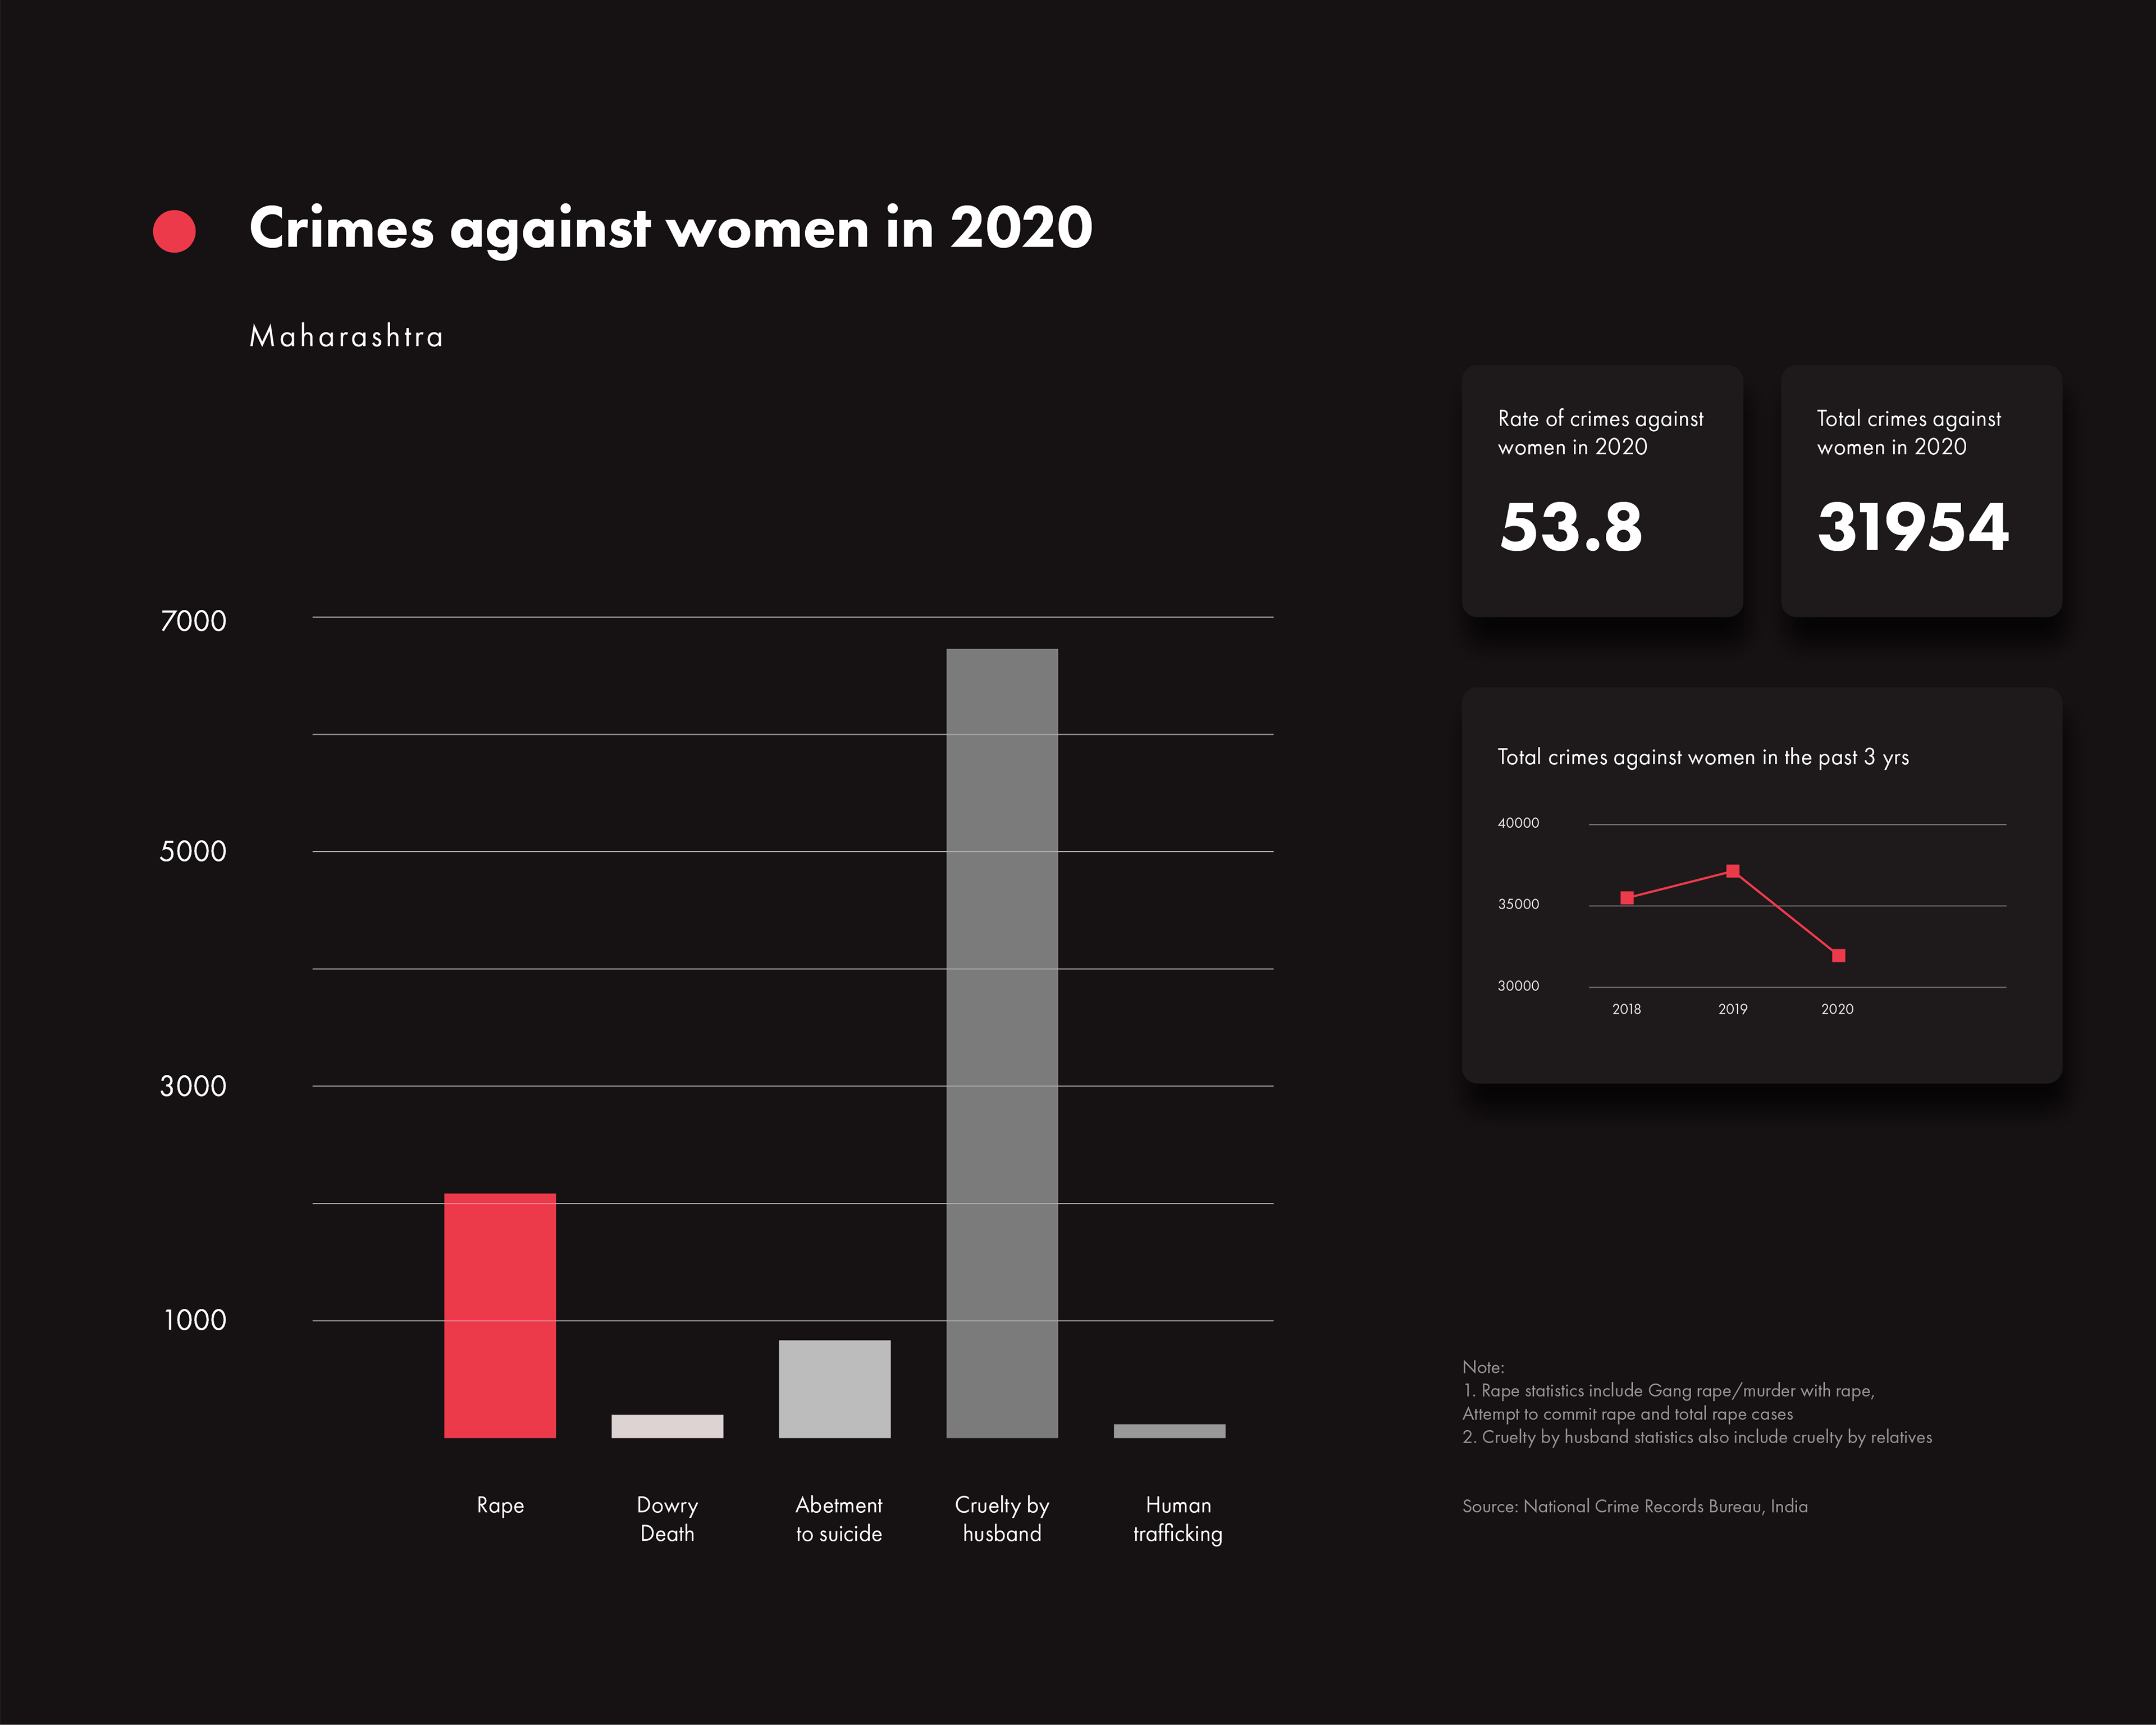
Apart from showing the data using tree-like visuals, one can also view the data in a graph-like format by switching views using just one click.
Details:
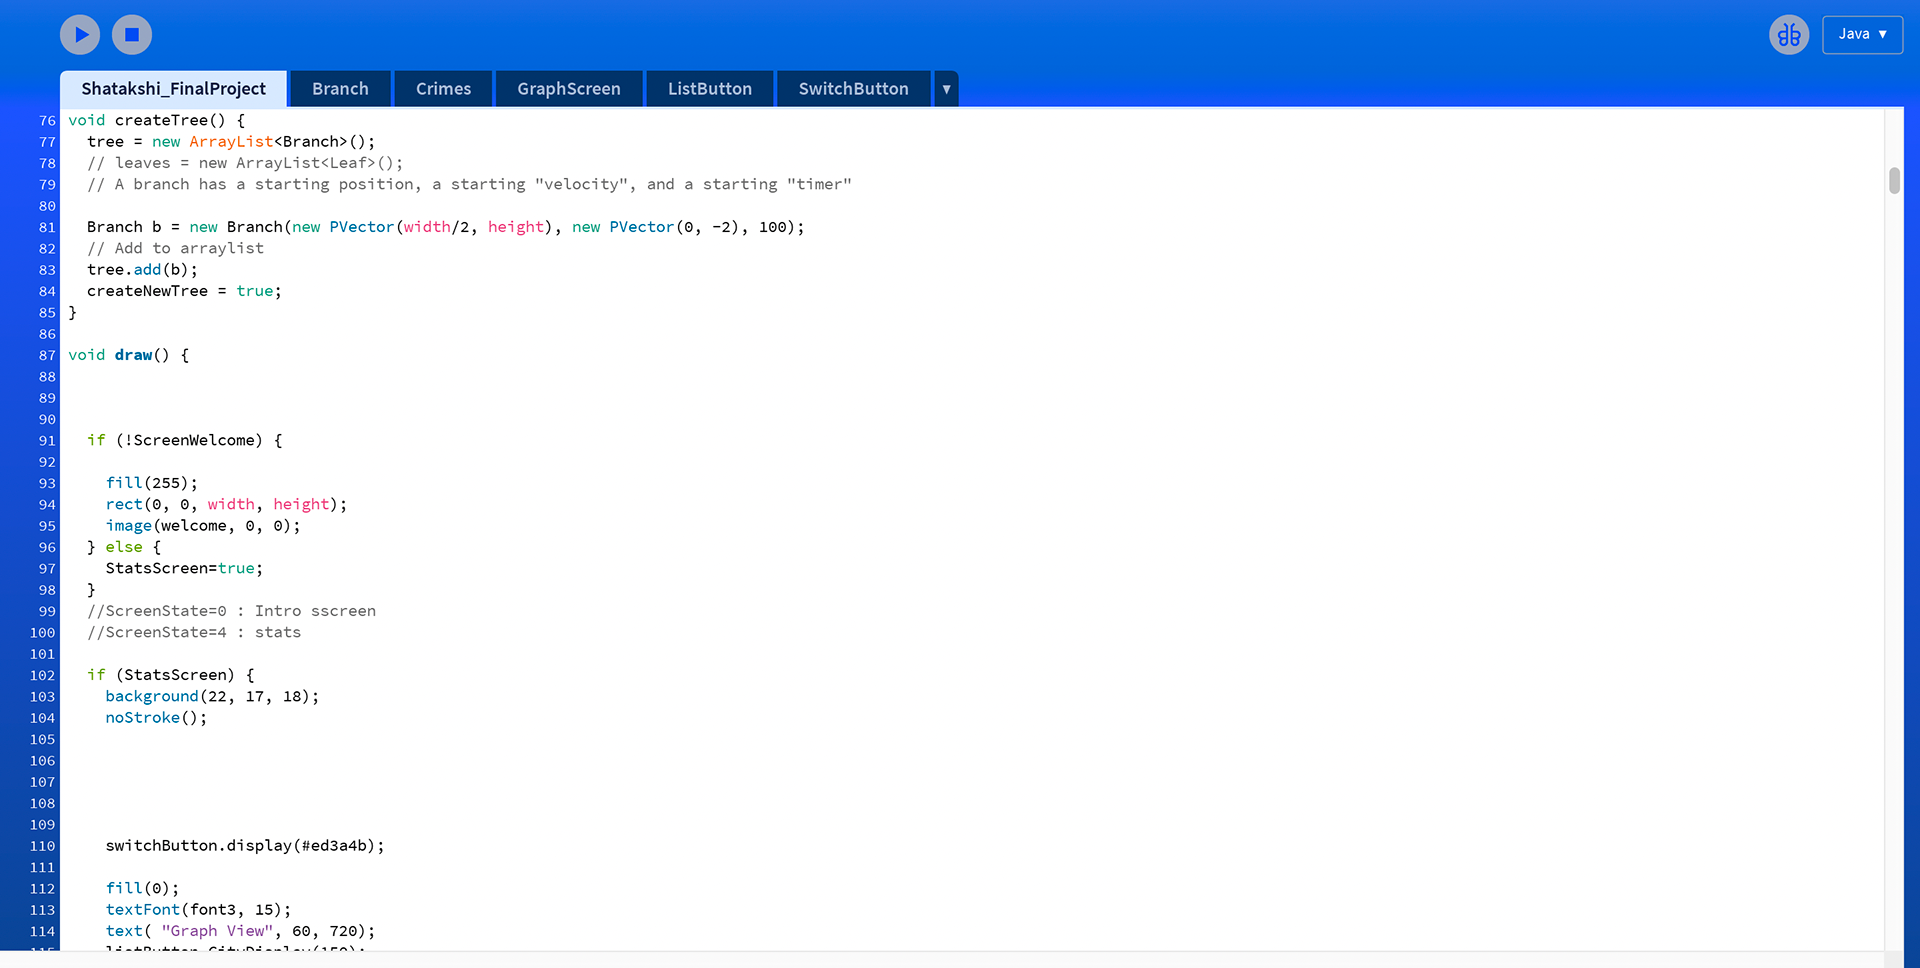
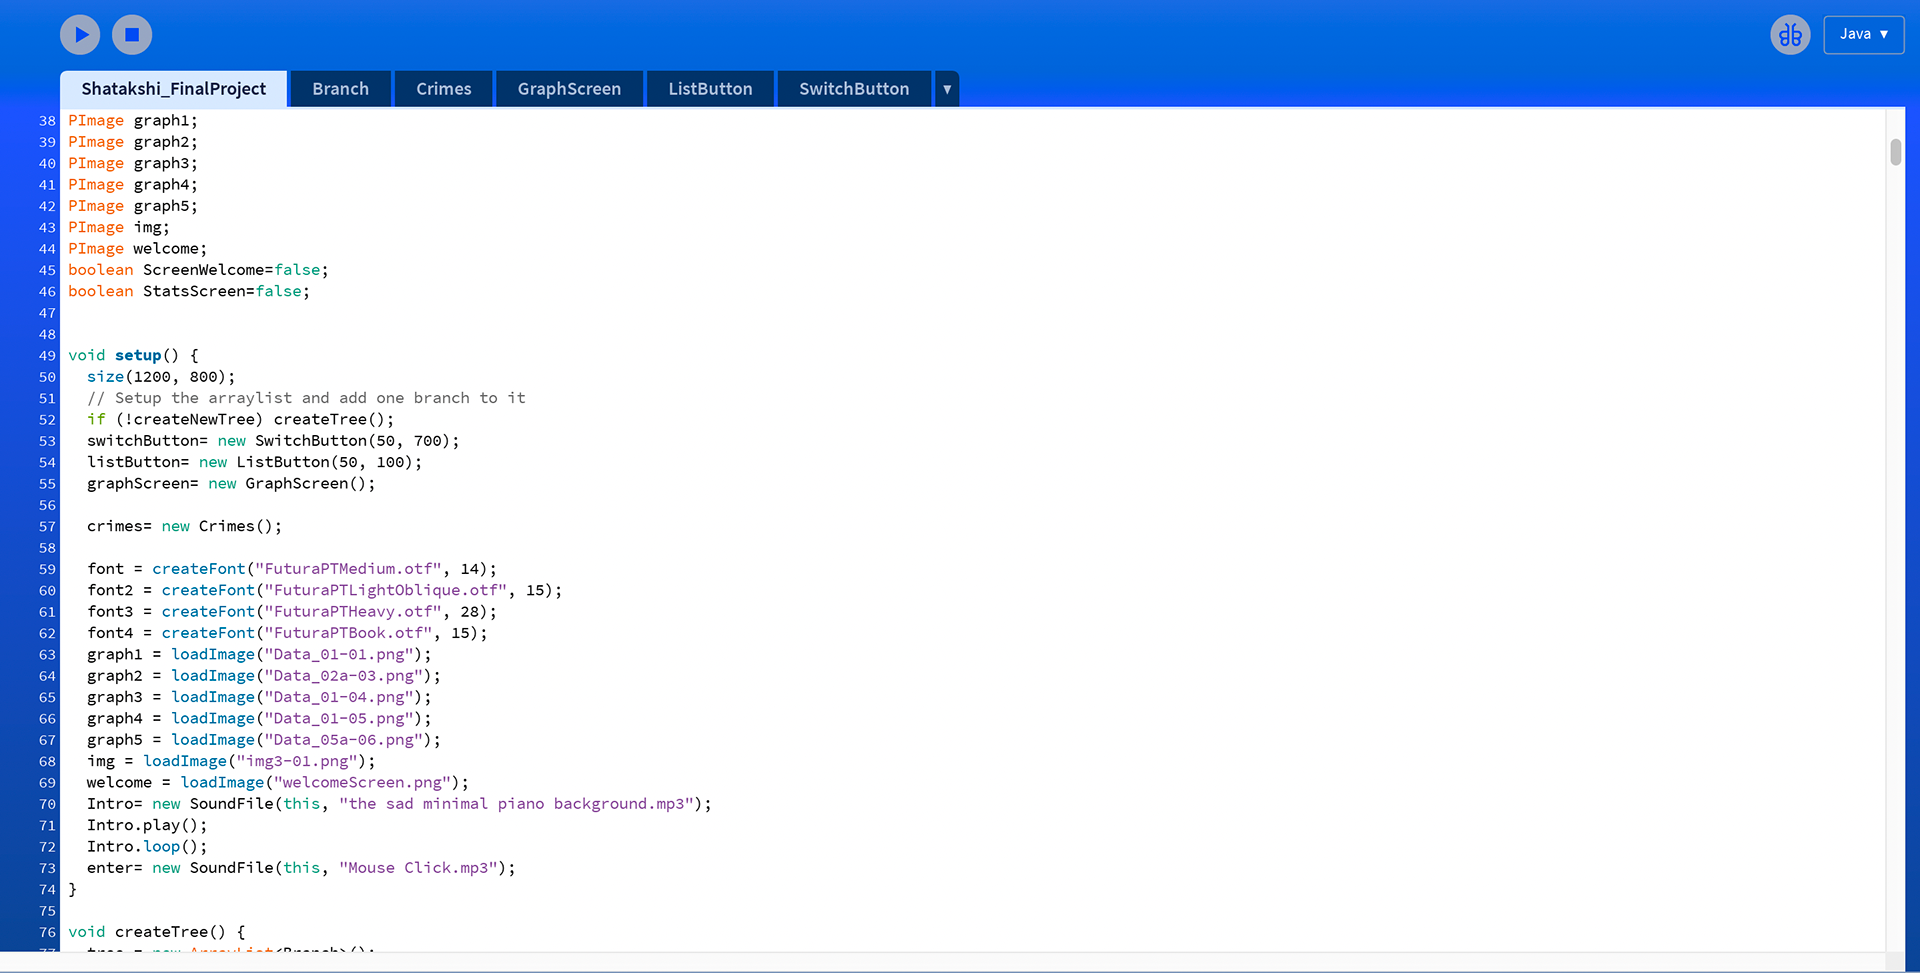
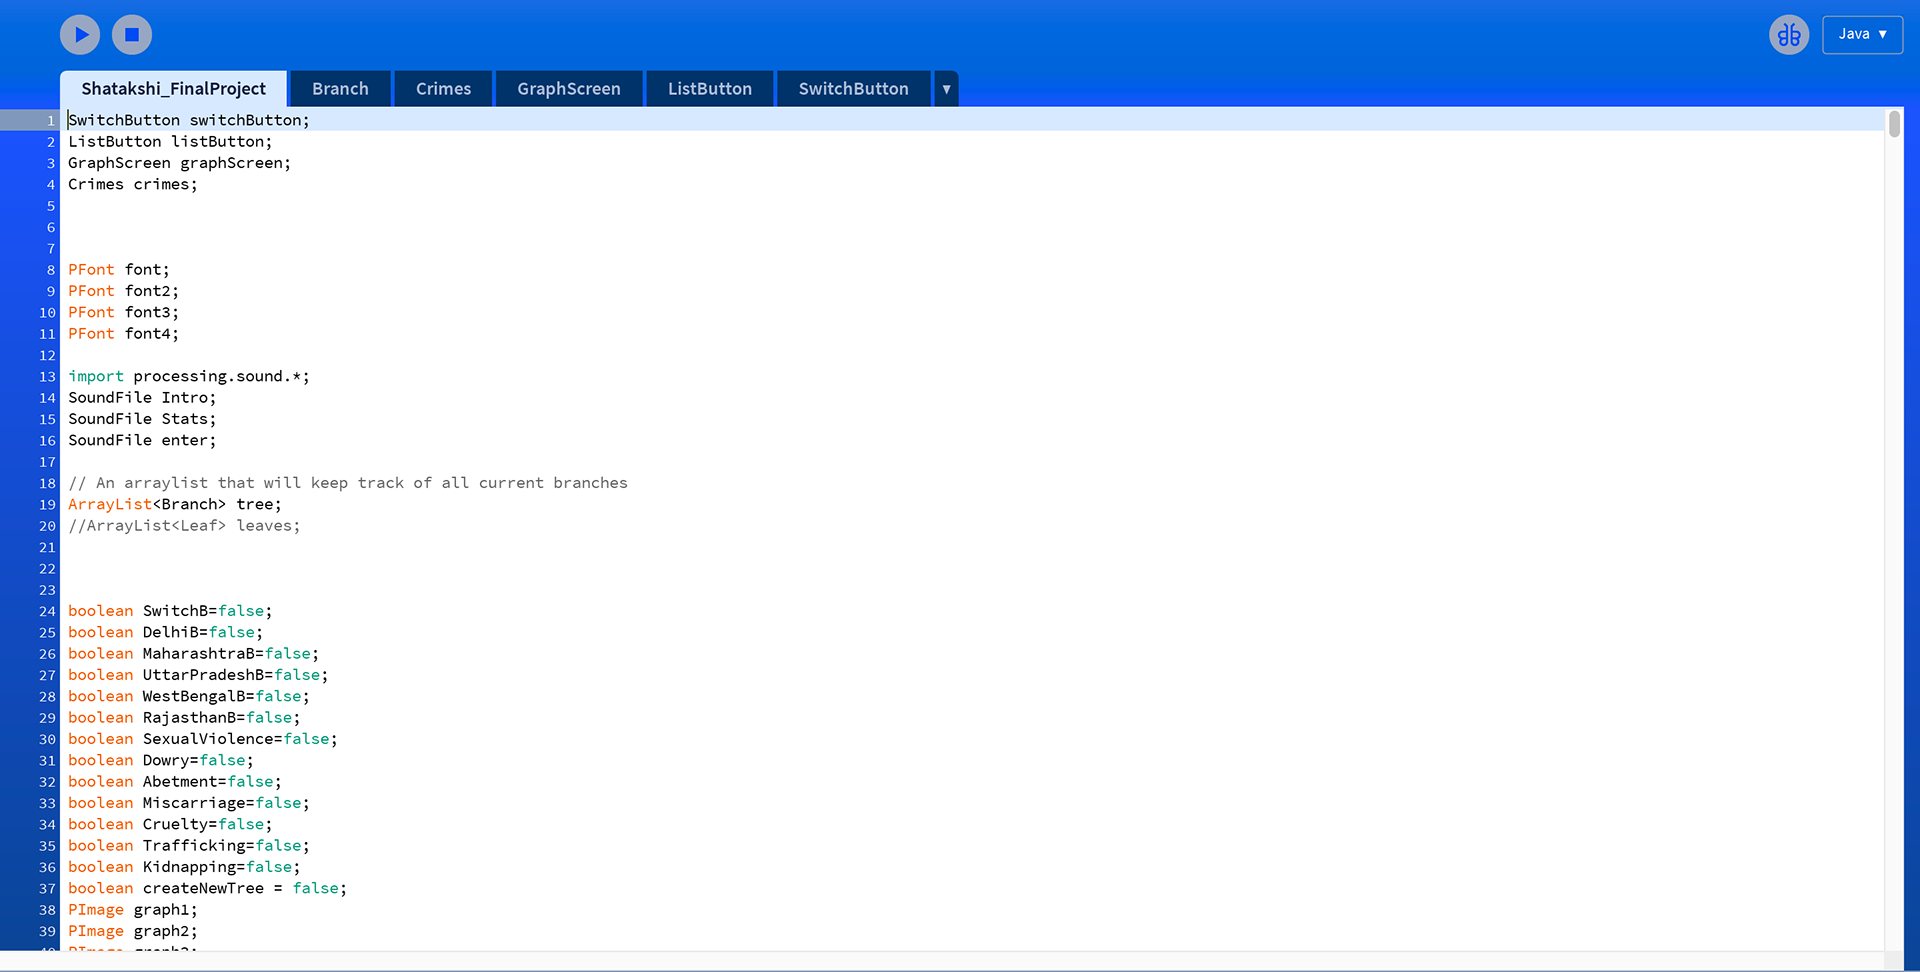
Code: